
My last blog highlighted that BTerrell Group is converting our internal books to Intacct, and we're having fun with some of the features. We’ve set up the dimensions of location, department, project, vendor, customer and employee to be able to easily slice and dice the data and report margins several ways. I’ve used the handy ALT+D+ALT+Enter keystrokes to open a contemporaneous instance to check data or tweak a report without having to exit what I’m doing.
Now I’d like to highlight a couple more features that have made this transition easy and fun. I want to create a dashboard with a real-time P&L by customer. Sounds complex, right? How long do you think that will take? The answer's an easy one...it takes just a few steps and we have a new report in the dashboard in just a few minutes.
Let's walk through the process:
Step 1: Select a report that is similar to what you want. Click on the magnifying glass icon to open up the report definition.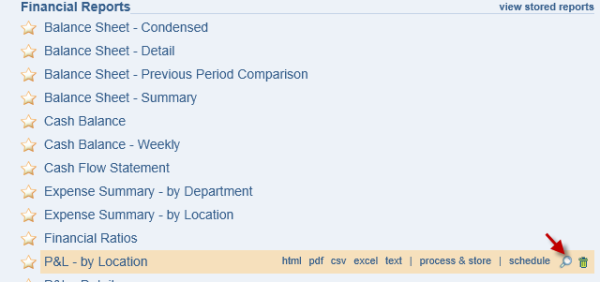
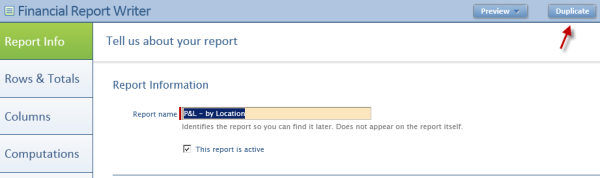
Step 2: Duplicate the report and save it as another name.
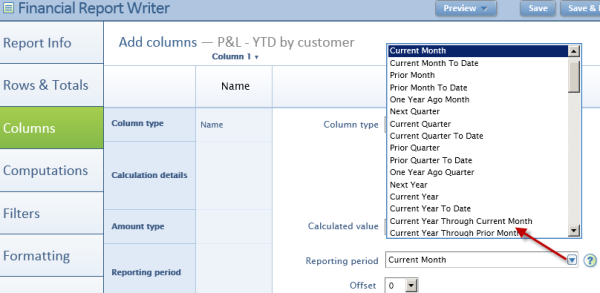
Step 3: Find the new report in the list and click the crayon icon to edit the report definition.

On the Columns tab, change the reporting period from Current Month to Current Year through Current Month.
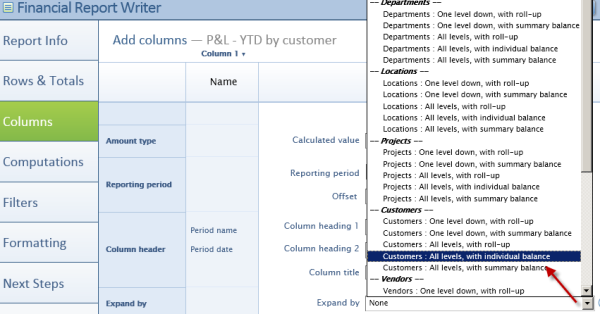
Then change the Expand by definition from None to Customers: All levels with individual balance. Save the report.
Step 4: Select the Create New Dashboard option in the Dashboards menu.
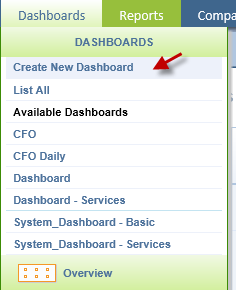
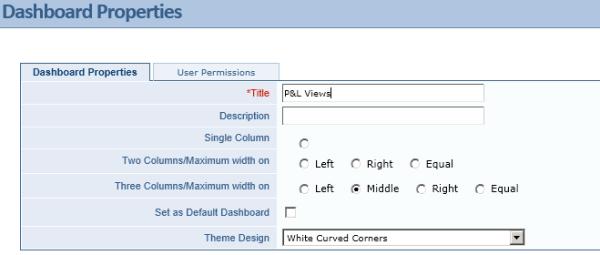
Enter a title in the Properties screen and save.
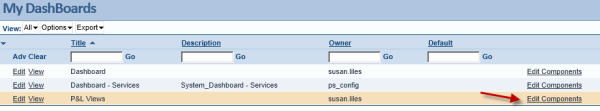
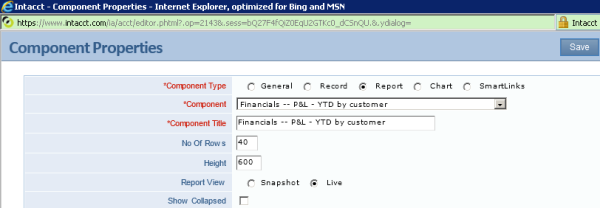
Step 5: Select the Edit Components function on the dashboard just created.
Click Add, then select the report that you want added to the new dashboard.
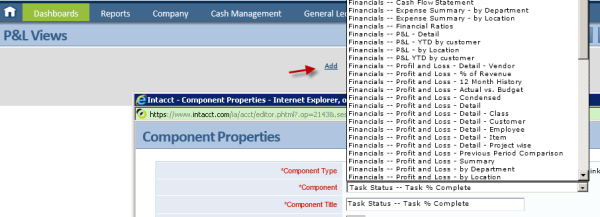
Select Live vs. Snapshot to keep the report current, and save the dashboard.
The new dashboard appears with the live report! (Note that data presented is completely fictional)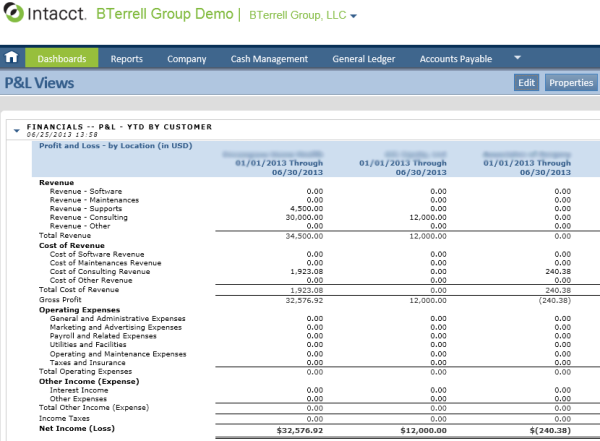
Visit www.bterrell.com for more info or schedule a free 30 minute consultation to explore if Intacct would be a great fit for your company.
A new setup in a new system could be the start of a completely new way to see your business!


