
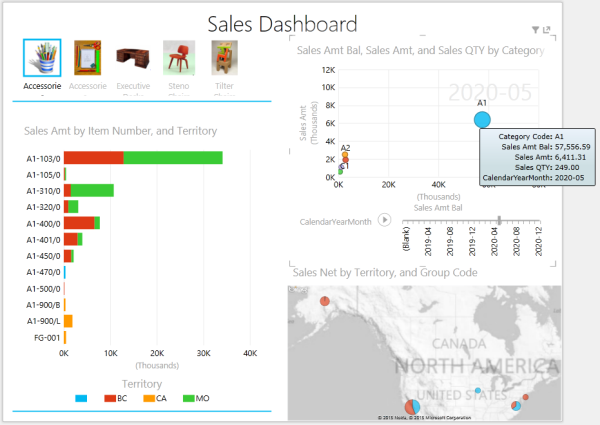
This is my final blog wrapping up our series on Sage 300 ERP operational data analysis using PowerPivot. Follow this link to interact with the workbook. Please note, you need Excel 2013 Professional Plus and will need to enable the Power View add-in for the interaction with the “Sales Dashboard”, as shown in the first screenshot below.
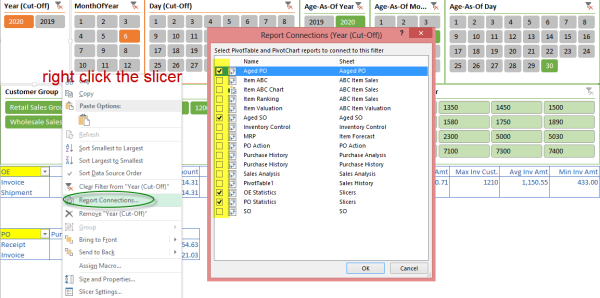
As you work with the slicer, please note that some of the slicers are linked to more than one report, as shown in the second screenshot below.
Below, are the worksheets included in the workbook and the links to the blogs about them. Follow this link for a static view.
- Inventory Control
- ABC Item Sales
- ABC Item Valuation
- SO
- Aged SO
- Sales History
- Sales Analysis
- PO Action
- Aged PO
- Purchase History
- Purchase Analysis
- Item Forecast
Screenshot 1:
Screenshot 2:
I hope you've enjoyed this series of blogs, and that they've helped you with using PowerPivot to analyze, manipulate and report on Sage 300 ERP data.
In the next blog, I will talk about payroll analysis using PowerPivot.

